Month: May 2013

A bunny fence, an angry summer and the land-climate interface

This was originally produced as a contribution to Murrang Earth Sciences.

I remember back when I was an undergraduate being very excited at the idea of becoming a climatologist. I was so impressed with the power of the climate system.  ​​​​​

The coming and going of the ice ages fascinated me. The vast ice sheets had such a huge impact on the land surface, carving out deep valleys and laying down fertile soil in their wake. Even the great rainforests were at the mercy of the climate system, expanding through the warm interglacial periods and then, inevitably, being driven back into their small refuges during the bitter ice ages.

At that stage, I believed that changes in the ice sheets, oceans and atmosphere governed nearly all these physical processes. The rainforests grew where climatic conditions permitted and the extent of our dry sclerophyll forests was also predetermined by the climate.

I eventually discovered my naivety. Of course our vegetation is equally impacted by land surface changes, with vegetation extent limited by soil type and nutrient availability. This is intuitive, although not to my eager and naïve young self!

I since learned that the land surface is intimately connected to the atmosphere. Indeed, our canonical understanding of the earth’s system views the land surface and atmosphere as complex interacting components of the climate, which interact with each other through feedbacks.

A famous meteorological example of the interconnectedness of these realms is the bunny fence experiment from Western Australia.  Southwestern WA is a region of drastic land use change – estimates indicate up to 13 million hectares of native perennial vegetation has been cleared to make way for crops in a process described as “brutal”. Extensive land clearing also coincided with abrupt reductions in regional rainfall.

Here, a 750 km long fence erected for protecting crops from rabbits (the bunny fence) delineates undistributed, heterogeneous native vegetation on one side and comparatively uniform crops the other.

Climate model-based studies demonstrate that large-scale land cover changes in the area can explain the observed decline in rainfall: decreased surface roughness from shifting to crops resulted in changing moisture transport and dramatically reduced the likelihood of rainfall in the region.

This example typifies the strength, and importance, of land surface coupling to the atmosphere.  However, the connectedness of the atmosphere and the land surface goes deeper, as conditions below the surface also have a large impact of the climate system on seasonal timescales.

The land surface is essentially the lower boundary of the atmosphere and there is an exchange of energy, water and chemical between the two realms at this boundary. Water in the subsurface, in particular, imparts an important control on the state of the atmosphere, both spatially and temporally.

Let’s take a look at the impact of soil conditions on air temperatures. If we imagine a region in which there is abundant soil moisture, then a large amount of energy from the sun will be will be used for evapo(transpo)ration of moisture, rather than simply heating the land surface. This is called the latent heat flux.

Conversely, if we imagine a dry region, where soil moisture is lacking, then no evaporation will take place, and the incoming energy from the sun will go straight towards heating the land surface directly. This is the sensible heat flux and leads to warmer surface air temperatures.

These processes are most important in regions that are neither too wet, nor too dry. In regions where soil moisture changes season-to season or year-to-year, the condition of the soil becomes important factor influencing temperature variability.

Australia is known to have a highly variable climate, but can this be related to soil moisture variability? The Bureau of Meteorology investigated this problem using a climate model and a suite of experiments that were driven by different soil moisture conditions. They determined that atmospheric variability in Australia is strongly linked to soil moisture, with variability in both temperature and rainfall connected to soil moisture conditions.

This relationship was strongest in summer and linked closely to changes in the El Nino-Southern Oscillation (ENSO), which is an important driver of year-to-year changes in climate in our region. A key outcome of this study was that having a good grasp on soil moisture conditions is imperative for being able to forecast seasonal climate conditions. It’s now clear that the land surface and atmosphere are strongly connected, with important feedbacks occurring between the two.

Our recent summer was the hottest ever recorded, with temperature records broken on daily right through to seasonal timescales. Conditions were so severe it was called the ‘angry summer.’

Our previous two hottest summers occurred in conjunction dry conditions associated with very strong El Niño events. But during our recent record hot summer, ENSO conditions were neutral, and occurred following two years of exceptionally heavy rainfall associated with an extended La Niña event.

I can’t help but think we dodged a bullet during our angry summer. The heat was certainly uncomfortable, but it can lead to far worse than discomfort in the bushfire prone, highly populated areas of eastern Australia.  In these regions, extreme heat is often associated with catastrophic fire weather.

If the recent heat had occurred when soil conditions were different and, consequently those latent and sensible heat fluxes were altered, how bad could it have been?


The citizen scientist

I have wanted to be a scientist since I was five years old. My favourite relics from my childhood include my microscope (complete with pre-made slides and a slide making kit), my children’s encyclopedia and my little telescope.

I finished high school, spent several years as an undergraduate and then wrote my honours and PhD theses in palaeoclimatology. The day I started my jobs as a research fellow, I woke very early, excited I was going to be a scientist. Finally!

Since I started my research fellowship, I’ve discovered that I need not have waited two and half decades to realise my dream. Nowadays, high quality, peer reviewed science is full of the citizen scientist. These are large networks of ‘amateur experts’ who help to collect and analyse scientific data in collaboration with a researcher.

Several of my scientist colleagues have been involved in projects that require the assistance of volunteers. One project involves volunteers digitising early records of Australian weather from weather journals, government gazettes and our earliest observatories.  This project has been going for sometime now and has already provided us with a better understanding of the climate history of southeastern Australia.

I have already discussed research on the impact of the common myna on Australian native bird species. This particular research showed that the myna was not as detrimental to native species in the area of study as we had originally thought. These outcomes were only possible because of long-term observations from a band of committed volunteers.

Personal computers provide another great resource for scientists looking for citizen collaborators. In one ongoing project, climate scientists conduct experiments using publicly volunteered distributed computing. Participants agree to run experiments on their home or work computers and the results are fed back to the main server for analysis.

Oxford University has now produced over 100 million years of climate model data using otherwise idle computer time.  These data have allowed researchers to gain a better understanding of climate models and also extreme climate events. Similar modelling projects are now being rolled out to other regions across the world.

Enlisting volunteers allows researchers to investigate otherwise very difficult problems. In my examples, the research would have been financially and logistically impossible without citizen participation.

If you want to become a scientist, by all means go to university and undertake a higher research degree. I loved it! But it also turns out there’s lots of other ways to be a scientist.

Drowning in data

I started my position eighteen months ago now and in that time, I’ve generated well over 50 terrabytes (Tb) of data.

Files are jammed into folders wherever I can squeeze them. Storage space is so tight, my data are essentially shoved under the beds of other researchers and in their wardrobes.  One day soon, it’s likely one of my colleagues will unknowingly go searching for something, open a virtual door and all my data will spill out onto the floor. I will be forced to confess that I’ve been hogging their storage space for sometime now.

I’m not the only one being overwhelmed by an avalanche of research data. Recent technological change is enabling the generation of increasing amounts of research data, which presents huge problems for data management and preservation.

Until recently, I was blissfully ignorant of any necessity to manage and preserve data. When I finished my PhD and moved on to my current institution, I neatly packed up my physical samples (bits of Indonesian stalagmites), labelled them and patted myself on the back. So organised, well done!

Meanwhile, I had one last research paper to write. My computer exploded (literally) just after I finished my draft and emailed it to my co-authors. In my eyes, it was perfect timing. I could put my PhD behind me and start afresh.

Last year, I was “volunteered” to sit on a data preservation and archiving advisory group at my university. I have since discovered that data generated as part of a funded research project that leads to a publication must be preserved for a minimum of five years, if not longer.  Luckily I have reasonably comprehensive back ups of my old work, but it turns out that my computer’s explosion was not a fortuitous occurrence after all.

What if every researcher at my university produces 50 Tb of data a year, successfully publishes research papers and needs their data archived for at least 5 years? Grappling with the explosion of research data is a huge challenge for universities, particularly when we consider the added complications of new publication models, like open access.

Not only do we need to deal with mountains of data, we also have to consider various policy and ethical constraints. For example, how do we deal with sensitive data generated in medical research? Or what about data that are considered invaluable and must be keep for perpetuity?

A recent article in Nature  about data management highlights that our data mountain presents opportunities for the savvy.

University libraries are reinventing themselves and becoming more active partners in research, rather than simply repositories of information.  At Johns Hopkins University, the director of digital research and curation installed a huge data visualization wall in the library.  Students and researchers can explore some of the university’s research data using the television screens. Research products range from illustrated medieval manuscripts to images from the Hubble Space Telescope.

Many researchers feel they are too busy to invest time in data management. Or just like me, rejoicing my computer’s explosion, lack the knowledge to adequately manage their data. Meanwhile, libraries are increasingly filling this gap in data management expertise.

The Nature article notes that the recent shift in focus to digital data management isn’t necessarily a huge leap for libraries. They have always that the capacity to organize information, preserve it and make it available to researchers.

I hope researchers can also embrace the opportunities that come with our vast data management challenge. Generating new data can be expensive, both in terms of time and money and there is the potential to get more from our data by mining what already exists.  But for us to use our data more effectively, proper management and preservation is a necessity.

Whilst my university works on a data management strategy for the coming years, I am crossing my fingers and hoping that my 50 Tb of files don’t explode out of our supercomputer anytime soon.

The hardcopy version of my data storage approach (Anselm Kiefer's stack of lead books, Museum of Old and New Art, Hobart)

The hardcopy version of my data storage approach (Anselm Kiefer’s stack of lead books, Museum of Old and New Art, Hobart)

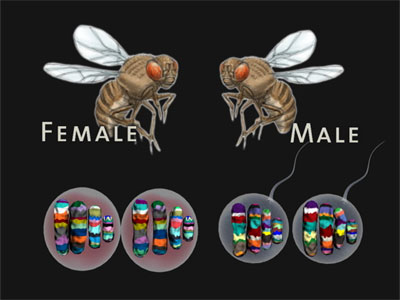
Drosophila melanogaster

It’s been a while since I’ve added someone to list of great scientist. Continuing on today’s theme of insects, I thought I’d branch out and elevate the humble fruit fly. Admittedly, Drosophila melanogaster can’t accurately be described as a scientist, but the species has made such a worthy contribution to science that perhaps we can overlook that for now.

The fruit fly, or more accurately, the vinegar fly, has been widely used in biological research for over a century.   It has been employed for research studies in genetics, physiology and developmental biology. Amongst other ideal characteristics, the flies breed quickly, are low maintenance and lay many eggs. The fruit fly was one of the first organisms to be used in genetic studies and now is the most genetically known of all organisms.

Male Drosophila melanogaster (from wikipedia)

Male Drosophila melanogaster (from wikipedia)

Thomas Hunt Morgan began using the flies for heredity studies in 1910 at Columbia University. He was working under the principle that as all organisms use common genetic systems, information on genetic coding obtained from fruit fly studies could be applied to other organisms, including people. Hunt was particularly attracted to Drosophila as a research tool because, like many modern researchers, he had little money or laboratory space in which to conduct his research!

His team went on to establish many important concepts that underpin our modern understanding of genetics. They discovered that genes are located on chromosomes, chromosomal inheritance specifies sex and that offspring inherit a mixture of their parents’ chromosomes.

Over the decades, Drosophila studies helped refine our understanding of genetic mutations. The entire DNA sequence of the Drosophila genome was eventually mapped, and proved a successful pilot for the equivalent human genome project.

People have 23 chromosomes, while Drosophila has a comparatively paltry four chromosomes. Nonetheless, 75% of known human disease genes have a recognizable analogue in the fruit fly genome.  That means fruit fly has been useful in study Parkinson’s and Alzheimer’s diseases, amongst others. They have also been used to investigate the causes of cancer, diabetes and addiction.

A recent article by Gary Hime (Professor of Anatomy and Neuroscience) explains that new biological processes are continually being investigated using Drosophila. In particular, this identifies that the fruit fly will be increasingly useful for understanding how climatic variation and urbanisation will affect the reproduction and survival of our agricultural species, pollinators and wild food stocks.

It’s quite a stretch to label the quick breeding, cheap Drosophila as scientists, and perhaps a little insulting to the capabilities of my fellow scientists! However, these little critters have been instrumental in developing our understanding of genetics and human disease and are worthy of recognition.

Bees in the news

The bees are swarming the news at the moment.

At the end of April, the European Union (EU) voted to restrict the use of neonicotinoid insecticides. Only 15 out of the 27 states supported the ban, which will occur as a two-year trial applying only to attractive crops. These are flowering crops that are of interest to pollinators, rather than the blander cereal crops.

The ban pertains to the neonicotinoids, which are similar to nicotine and act as a nerve agent. They are vastly popular as commercial insecticides but have dire consequences for pollinators after repeated ingestion.

I recently read a horrible description of a hive that was later found to have been contaminated by dust from seed corn that had been treated with the pesticide clothianidin.

“Confused honey bees huddled trembling outside their hives rather than taking off for their morning flights. Many dropped dead. Over the next 2 weeks, the bodies piled up and more than 11,500 colonies were hit by the mysterious affliction.”

Reports strongly suggest that the new European restrictions will make a difference.  A review is currently underway in Australia into the potential impacts of these insecticides, so let’s hope we follow soon.

In other news, a recent report from the US Department of Agriculture identified many threats to the health of honeybees. Nearly a third of US honeybees died during the last winter, prompting the statement that,

“We are one poor weather event or high winter bee loss away from a pollination disaster.”

Back in Australia, where many bees are exported yearly for commercial pollination in the States, we remain free of the Varroa destructor mite. For now.

Asian honeybees are increasingly creeping into Australia through a corridor in Far North Queensland. They are a natural host for varroa mites, so it’s really only a matter of time before there is a widespread infection of Australian hives.

In this case, the bees will need all the help they can get, including bans of insecticides, like the ones being trialled in Europe.

Rich getting richer, poor getting poorer

When it comes to future rainfall changes, getting richer isn’t necessarily a good thing.

As the climate warms, water-rich regions are projected to get wetter. These are areas where rainfall is already abundant and far exceeds local evaporation. Meanwhile, water-poor areas are expected to get drier.

This is the rich-get-richer, poor-get-poorer concept of rainfall responses to climate change. The specific humidity of air increases with temperature, according to the Clausius-Clapeyron relationships. This means that the moisture content of air increases in a warming world, which in turn generally leads to increases in rainfall.

In a recent study, climate scientists used various model projections to show that sea surface temperatures also complicate the rich-get-richer view of future rainfall. In this study, in regions located near warm waters, the models showed an increase in uplift of warm, moist air, and an overall increase in rainfall.

In this recent study, the rich-get-richer mechanism dominated the seasonal cycle. That is, wet seasons got wetter and dry seasons drier. But looking over an entire year, the proximity of warm ocean waters became more and more important for determining the rainfall response to global warming.

Increasing our understanding of future rainfall changes is critical for areas that are expected to get wetter and for those areas expected to get drier, as we are vulnerable at both ends of the rainfall spectrum.

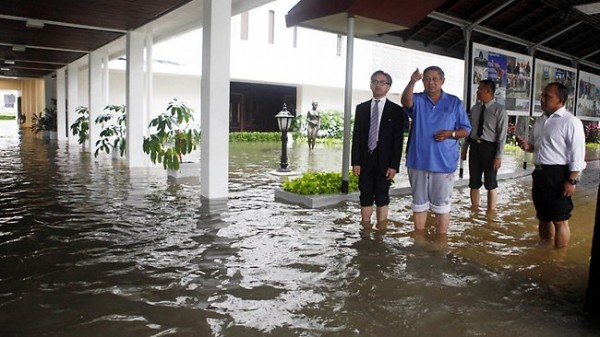
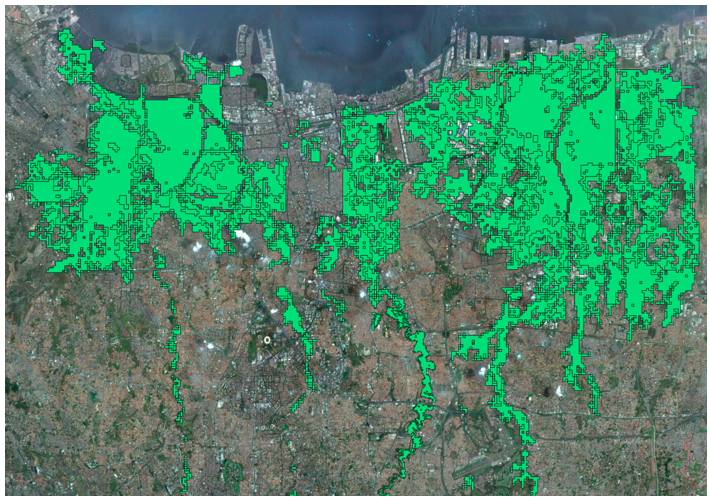
For example, heavy monsoon rains in January this year resulted in severe flooding and large-scale evacuations throughout Indonesia.  Indonesia is a heavily populated country, with 10 million inhabitants of Jakarta alone. It is influenced by the Indo-Australian monsoon from around November through to March and also lies just west of the very warm waters of the West Pacific Warm Pool. Jakarta is a very low-lying vulnerable city, with parts of the city below sea level where land has subsided due to groundwater depletion.

January 2013 flooding at the Indonesian Presidential Palace

January 2013 flooding at the Indonesian Presidential Palace

This recent study notes that models are consistently simulating increases in global monsoon rainfall under increased greenhouse gas emissions. If these future increases in monsoon rainfall occur over Indonesia, they are likely to have large impacts on a large number of people, particularly in terms of flooding in low lying areas.

Map of Jakarta flood risk areas based on 2007 flooding (http://openir.media.mit.edu/main/?p=1670)

Map of Jakarta flood risk areas based on 2007 flooding (http://openir.media.mit.edu/main/?p=1670)

In January 2011, heavy rain incapacitated huge swathes of Northeastern Australia. Flood damage was extensive: ¾ of the state of Queensland was declared a disaster zone.  Looking at this comparatively sparsely populated area, it’s clear how susceptible we are to hydrological extremes.

For many vulnerable people, with little capacity to actively respond to future climatic changes, getting richer in terms of rainfall has the potential to be disastrous.

At the very least, improving regional projections of rainfall changes will help us make useful adaptive decisions for those planning for more rain and for those planning to less rain.

A hiatus in warming?

I posted recently about cold snaps in a warming world. Although some suggest that these cold events prove the world has not warmed, I discussed how these are not problematic for our understanding of climate change. Indeed, we expect some places to experience quite severe cold snaps, as atmospheric circulations change.

Similarly, there has been a lot of discussion recently about the recent pause in surface warming. Some are adamant that this is unequivocal proof that the world is not warming at all.

Is this a reasonable conclusion? Has the world stopped warming?

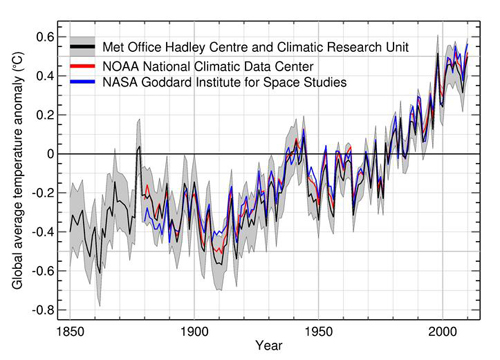
It turns out that there have been other decades, such as we see from 2000 to 2009, when the observed globally average surface temperature showed little increase, or possibly even a slight decrease. We describe these as hiatus periods.

Changes in global average temperatures

Changes in global average temperatures

These have occurred previously in observations and are also produced in climate model simulations. Rather than an indication of a cessation in global warming, they are indicative of changes in only one component of the climate system.

During these hiatus periods, although there is little change in temperature at the earth’s surface, the changes at the top of the atmosphere, well above the surface, show consistency with periods where surface heating occurred. That is, a net flux of energy is still being inputted into the earth’s system, but this is not being recorded at the surface.

Where does this excess heat in the climate system go during these hiatus periods when there is little or no increase in surface warming?

There was a comprehensive study of this problem in 2011 conducted by Gerald Meehl and colleagues using climate model simulation to investigate hiatus periods. They showed that model hiatus periods are linked to changes in ocean heat content.

During the hiatus periods in the models, the surface and shallow ocean did not take up much heat, but the ocean below ~300 metres was taking up more heat from the earth’s system than during the non-hiatus periods. That is, during the hiatus periods, the earth’s system was still warming in response to anthropogenic changes, but these were occurring in the deeper ocean, rather than at the surface.

This study suggests that the hiatus periods are relatively common climatic phenomena linked to natural variability in the climate system and particularly the state of the oceans.

The authors note that in model experiments with higher carbon dioxide concentrations, no such hiatus periods occurred. It seems possible that these hiatuses in surface warming will become less and less common in the future.

There are numerous studies that have investigated these hiatus phenomena and shown that these are entirely consistent with our understanding of the climate system and these hiatus periods do not invalidate our understanding of greenhouse gas-induced warming. It’s also worth noting that globally, the decade of 2001-2010 was still the warmest on record.

We can draw an analogy to our own physical system. Saying that a hiatus in warming at the earth’s surface disproves anthropogenic climate change is selectively looking at one small part of a complex system. It would be like declaring a patient in good health after observing a normal body temperature, regardless of any other symptoms indicative of dire health problems.